

What do NRR and GRR tell you?
Net Revenue Retention (NRR) shows how much recurring revenue from your existing customers is left after a period, including expansion. Gross Revenue Retention (GRR) only looks at losses from churn and downgrades, so it can never exceed 100%. New customers belong in neither metric. Both answer the same question from two angles: how resilient is your existing revenue?
Jump to: Formulas · Worked example · Common mistakes · Review steps · Sources
The formulas
The starting point is recurring revenue at the beginning of the period, usually the monthly recurring revenue (MRR) of the first month. The definitions below follow common SaaS metric explanations (see sources); what matters is that you apply them consistently in your reporting.
- GRR = (starting MRR – downgrades – churn) ÷ starting MRR
- NRR = (starting MRR + expansion – downgrades – churn) ÷ starting MRR
Expansion means, for example, upsells, cross-sells or higher usage by existing customers. Revenue from customers won during the period stays out.
Worked example with fictional numbers
Fictional, simplified example: A software company starts the month with EUR 100,000 MRR. During the month, existing customers add EUR 8,000 in expansion, EUR 3,000 is lost to downgrades and EUR 4,000 to churn. The company also wins new customers worth EUR 12,000 MRR.
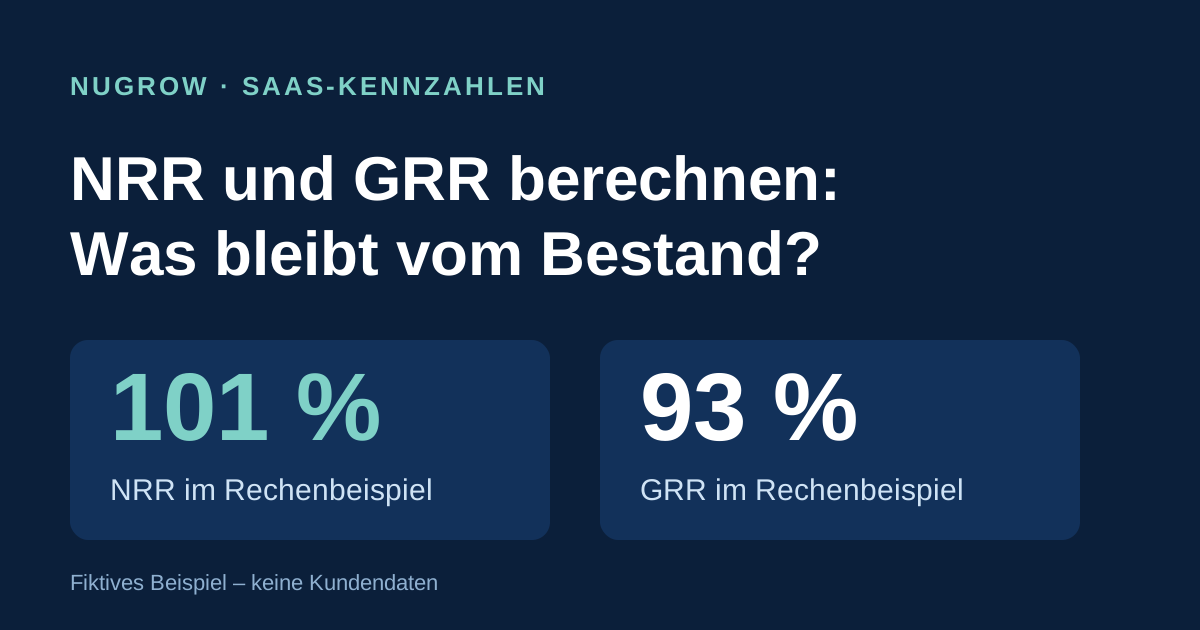
- GRR = (100,000 – 3,000 – 4,000) ÷ 100,000 = 93%
- NRR = (100,000 + 8,000 – 3,000 – 4,000) ÷ 100,000 = 101%
- Total MRR at month-end: 100,000 + 8,000 – 3,000 – 4,000 + 12,000 = EUR 113,000
The 13% total growth therefore consists of a slightly growing base (NRR 101%) and new business. An NRR just above 100% means expansion only just offsets the losses. Without the EUR 8,000 of expansion, the base would stand at 93%.
Common calculation mistakes
- Including new customers in the numerator: This inflates NRR and mixes the quality of the base with sales performance.
- Comparing different periods: Monthly and annual values are not directly comparable. Decide whether you look at one month or an annual cohort, and state the period in the board pack.
- Including one-off revenue: Setup fees, consulting hours or VAT are not recurring revenue.
- Not separating expansion cleanly: Show price increases, upsells and higher usage separately so it stays visible where an NRR above 100% comes from.
- Showing only NRR: A high NRR can hide many cancellations if a few customers expand strongly. GRR makes the loss visible.
Review steps for your reporting
- Write down the definition: which revenue types count as recurring, and which period is measured?
- Build a base bridge: starting MRR, expansion, downgrades, churn, new customers, ending MRR. The sum must add up.
- Reconcile sources: billing system, CRM and accounting should deliver the same customer list and the same amounts.
- Look at cohorts: broken down by start month or customer segment, you see where the base is getting weaker.
How the metric relates to revenue and cash receipts is explained in ARR, Revenue and Cash Receipts: Differences in SaaS Reporting. For the question of what a customer may cost, see Unit economics: CAC, LTV and template. Support with forecasting and KPI reporting is described under FP&A and Financial Modelling.
Frequently asked questions
What is the difference between NRR and GRR?
GRR only counts churn and downgrades and is at most 100%. NRR also includes expansion from existing customers and can therefore exceed 100%.
Do new customers count towards NRR?
No. Both metrics only look at revenue from customers who were already customers at the start of the period.
How do I calculate NRR?
NRR = (starting MRR + expansion – downgrades – churn) ÷ starting MRR. In this article's worked example, the fictional numbers give 101%.
Which period should I use for the calculation?
That depends on your reporting. A month or an annual cohort is common. What matters is to apply the chosen period consistently and to state it in your reporting.
Sources
The worked example was created by nugrow and contains no customer or benchmark data. As of October 2026.